Kenwood Reserve
Kenwood Reserve offers an established custom-home environment in the Falls Lake area of Wake Forest.
Kenwood Reserve offers an established custom-home environment in the Falls Lake area of Wake Forest.
Kenwood Reserve offers an established custom-home environment in the Falls Lake area of Wake Forest.
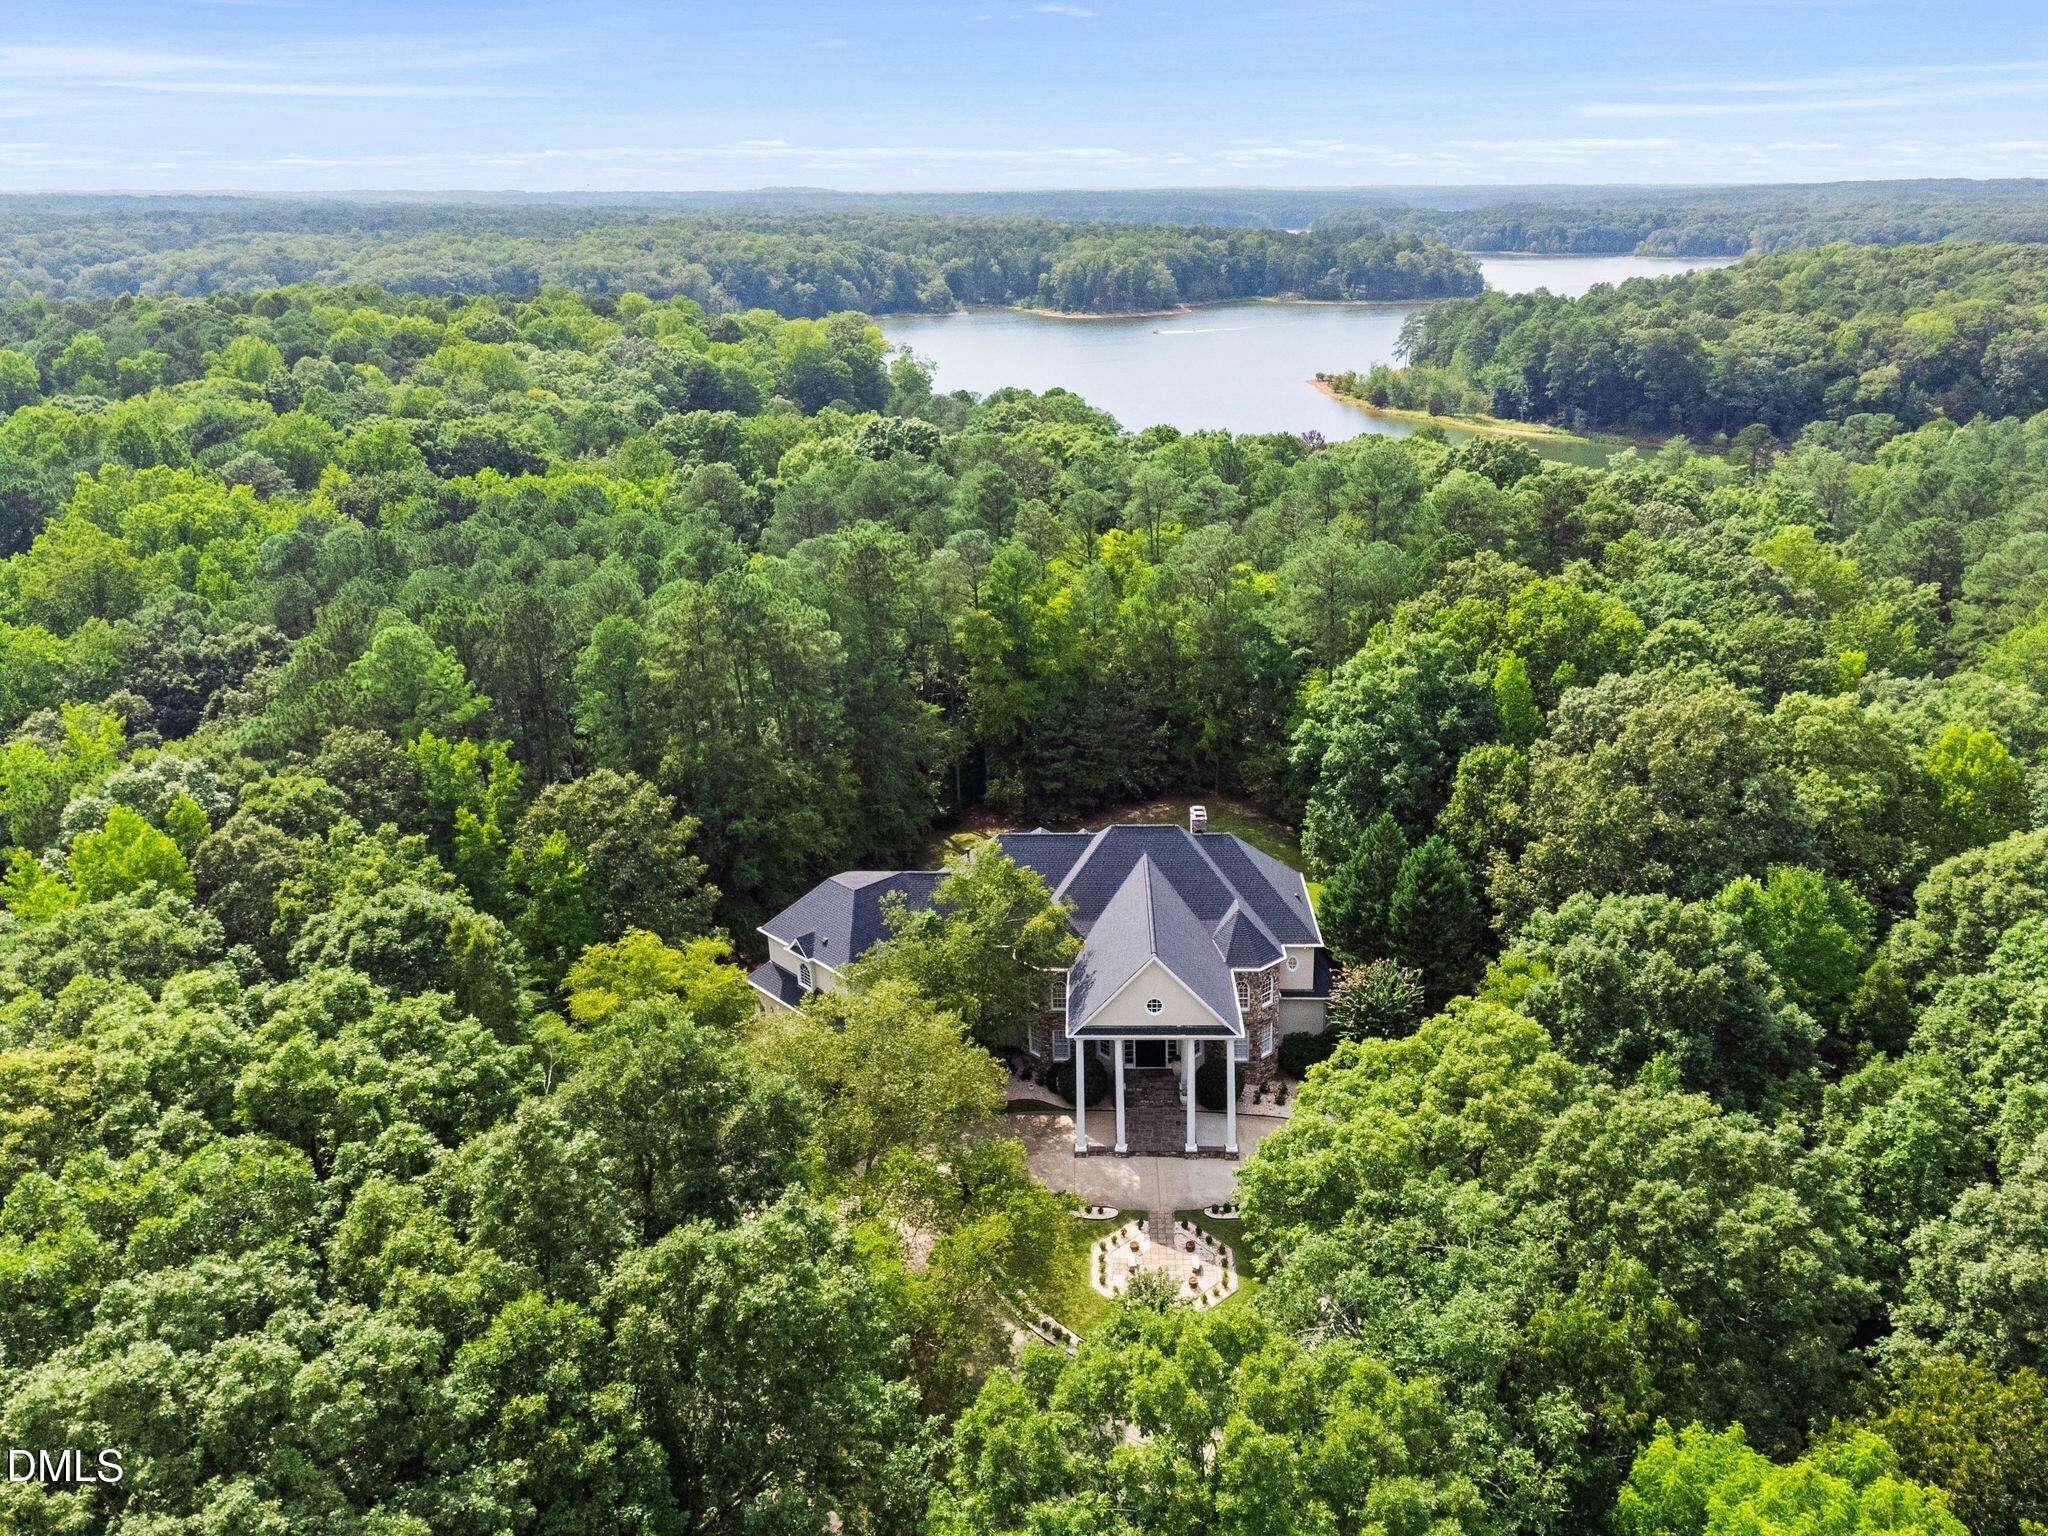
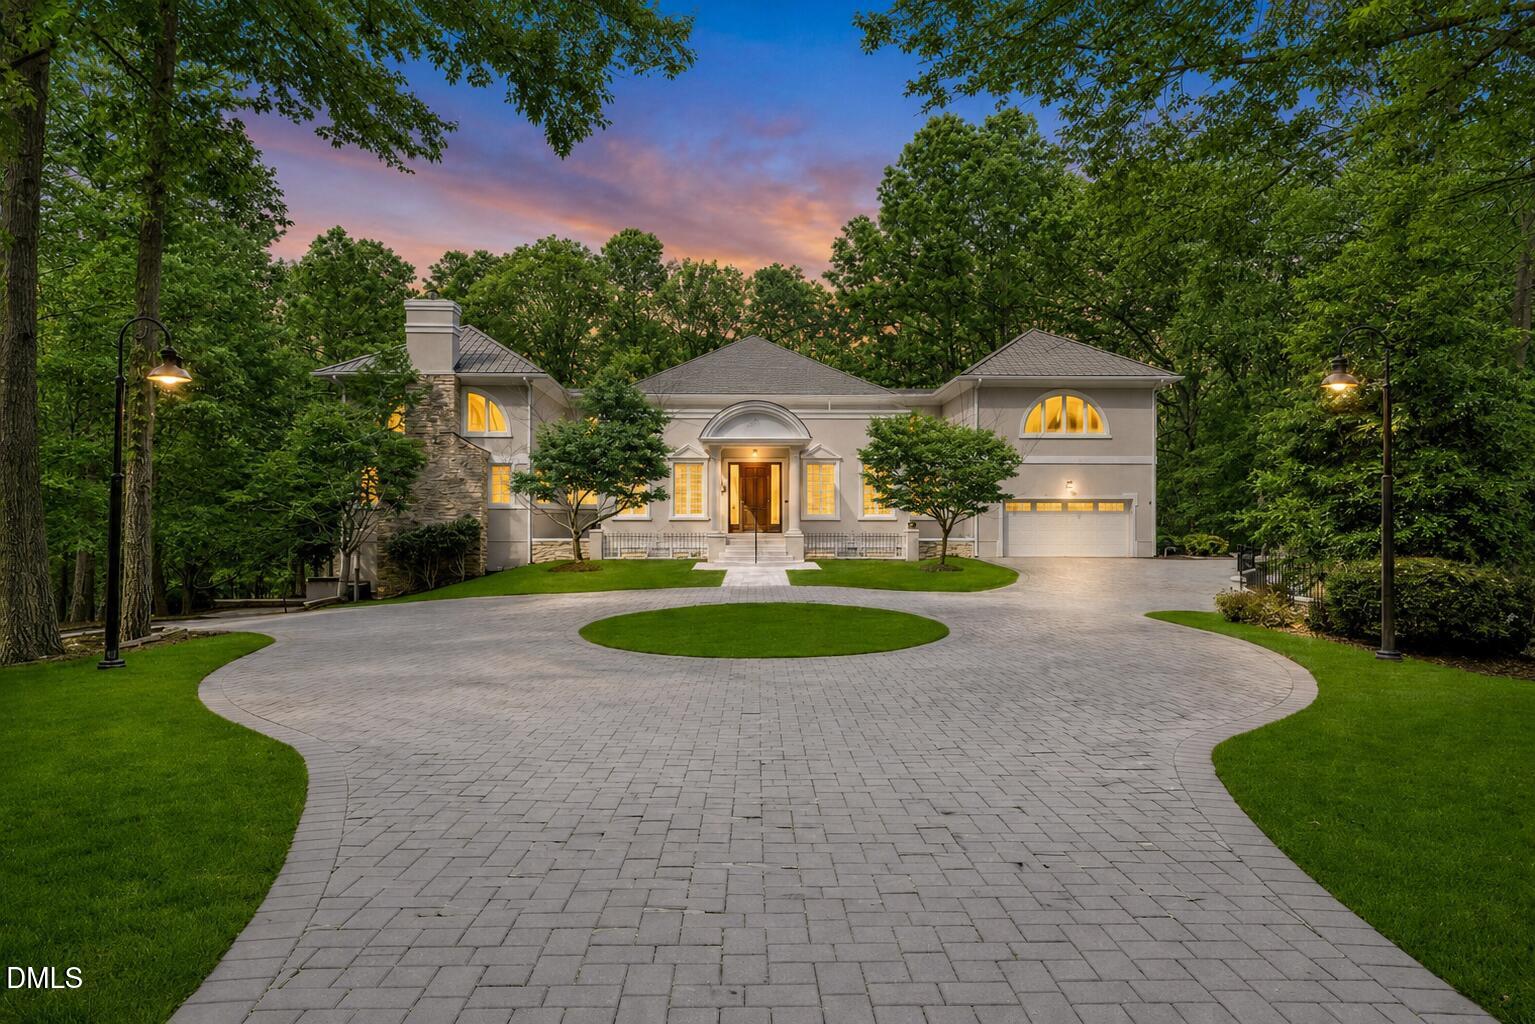
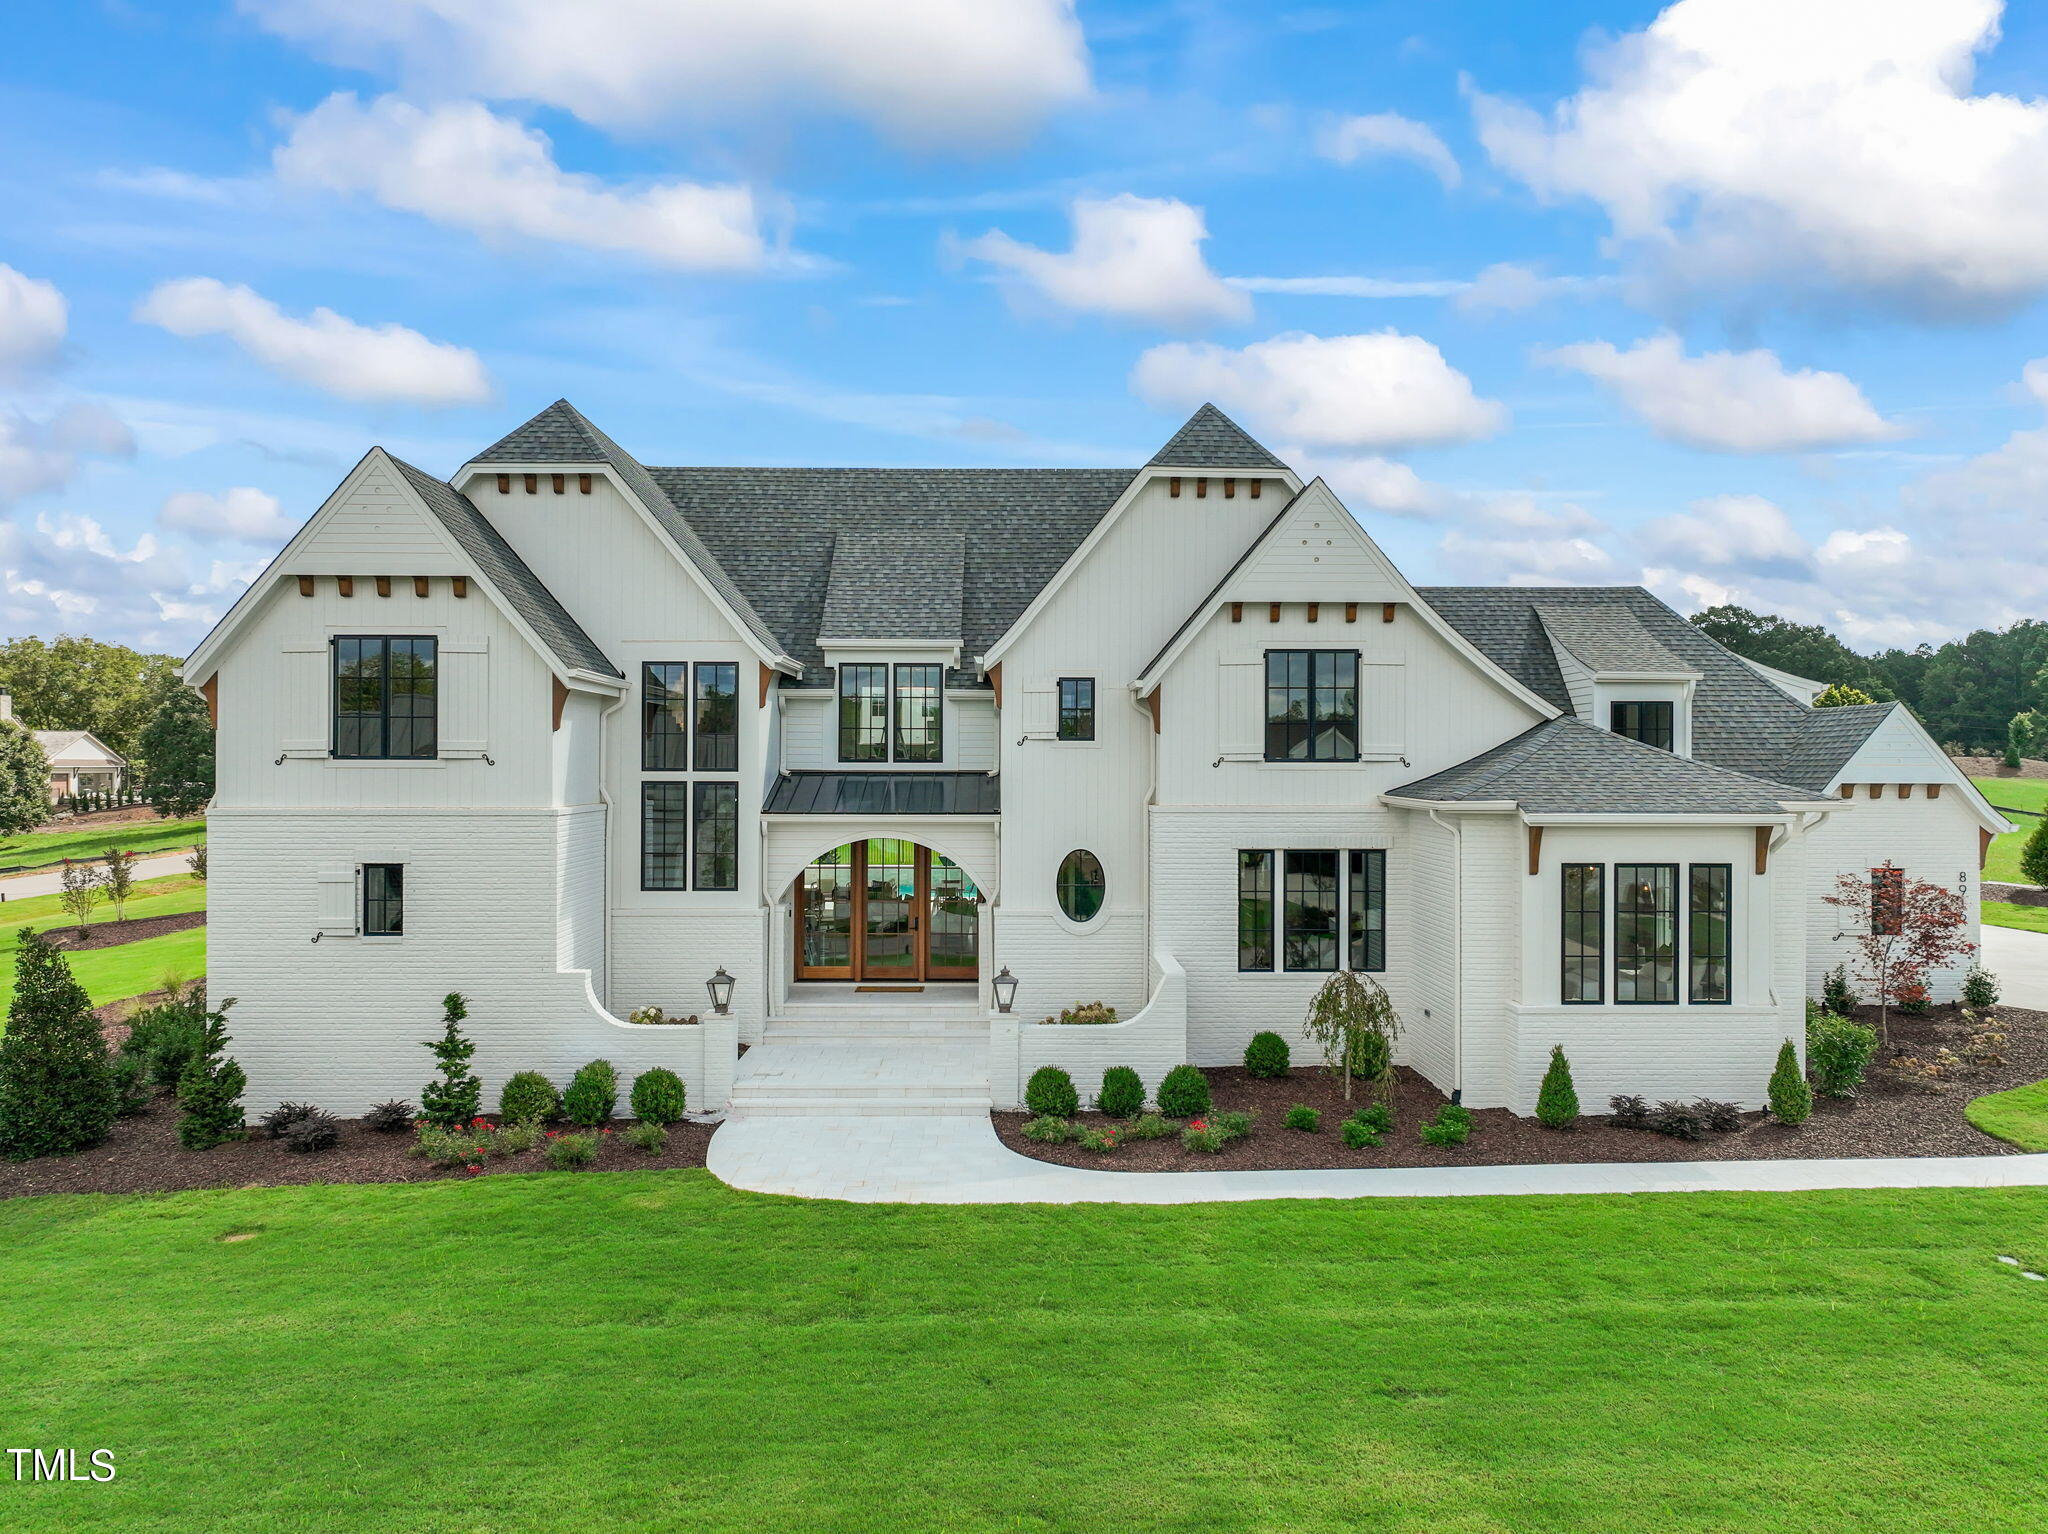
The community is characterized by larger homesites, mature wooded surroundings, individually designed residences, and a lower-density feel than many newer developments.
Certain homes benefit from adjoining open-space or natural buffer areas, creating particularly private settings. Individual homes may also include pools, finished lower levels, extensive outdoor living, recreation spaces, and other custom features.
Because lot configuration, architecture, improvements, and privacy can differ considerably from one residence to another, Kenwood Reserve is a market where property-specific analysis is especially important.
Nearby Falls Lake and B.W. Wells recreation areas contribute to the outdoor lifestyle of this part of Wake Forest. Access, views, waterfront rights, and other lake-related characteristics are always property-specific.
HOA / community reference: Kenwood Reserve HOA
81,902 people live in Kenwood Reserve, where the median age is 40.8 and the average individual income is $55,532. Data provided by the U.S. Census Bureau.
Total Population
Median Age
Population Density Population Density This is the number of people per square mile in a neighborhood.
Average individual Income
Kenwood Reserve has 29,199 households, with an average household size of 2.77. Data provided by the U.S. Census Bureau. Here’s what the people living in Kenwood Reserve do for work — and how long it takes them to get there. Data provided by the U.S. Census Bureau. 81,902 people call Kenwood Reserve home. The population density is 779 and the largest age group is Data provided by the U.S. Census Bureau.
Total Population
Population Density Population Density This is the number of people per square mile in a neighborhood.
Median Age
Men vs Women
Population by Age Group
0-9 Years
10-17 Years
18-24 Years
25-64 Years
65-74 Years
75+ Years
Education Level
Total Households
Average Household Size
Average individual Income
Households with Children
With Children:
Without Children:
Marital Status
Blue vs White Collar Workers
Blue Collar:
White Collar:
Discover the personalized service, market expertise, and proven strategies that help our clients achieve exceptional results.